Please note the NCRI ceased to operate in July 2023. The following is for information purposes only.
Explore the information held in the Cancer Research Database using this interactive visualisation.
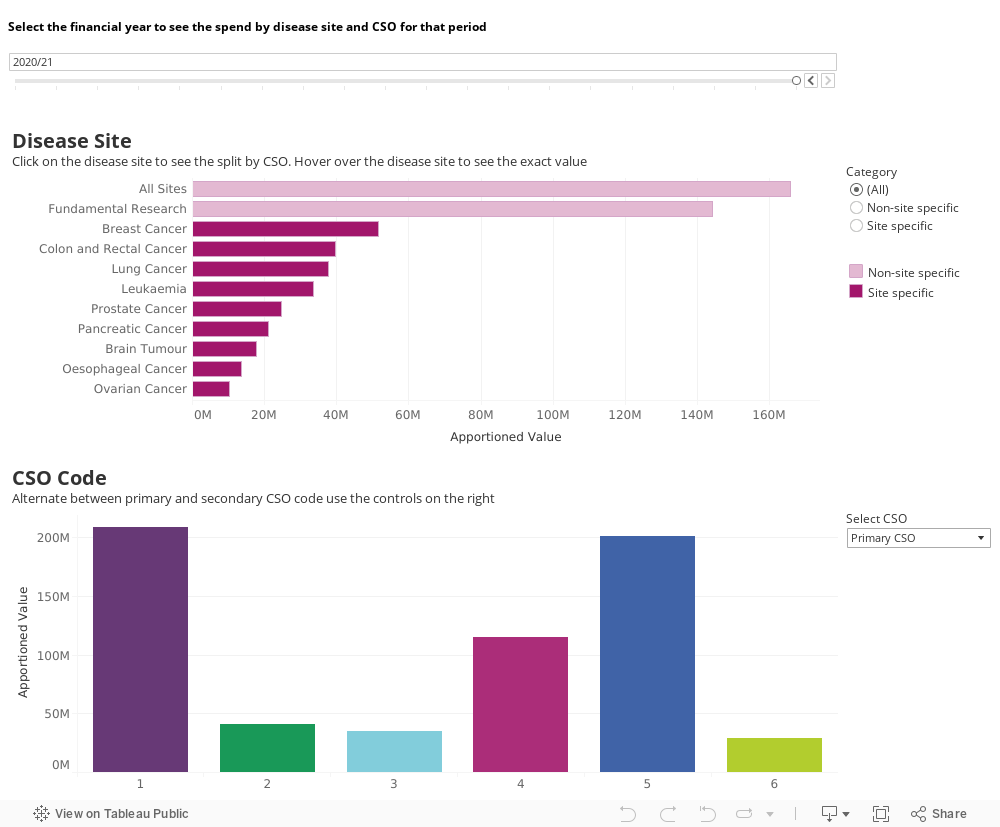
The top slider allows you to view spend for a specific financial year. The graphs below show how this spend is distributed across disease sites and research areas (CSO code). Further information on CSO codes can be found here.
Selecting a specific disease site will then show how the funding is split by research area – either primary or secondary CSO. Changing the financial year will reset the selection. Selections can be undone using the controls at the bottom of the page. Spend has not been adjusted for inflation and represents the cash value at the time the award was submitted.
*Please note, this visualisation is best viewed on a PC or Mac.