Please note the NCRI ceased to operate in July 2023. The following is for information purposes only.
Explore the information held in the Cancer Research Database using this interactive visualisation.
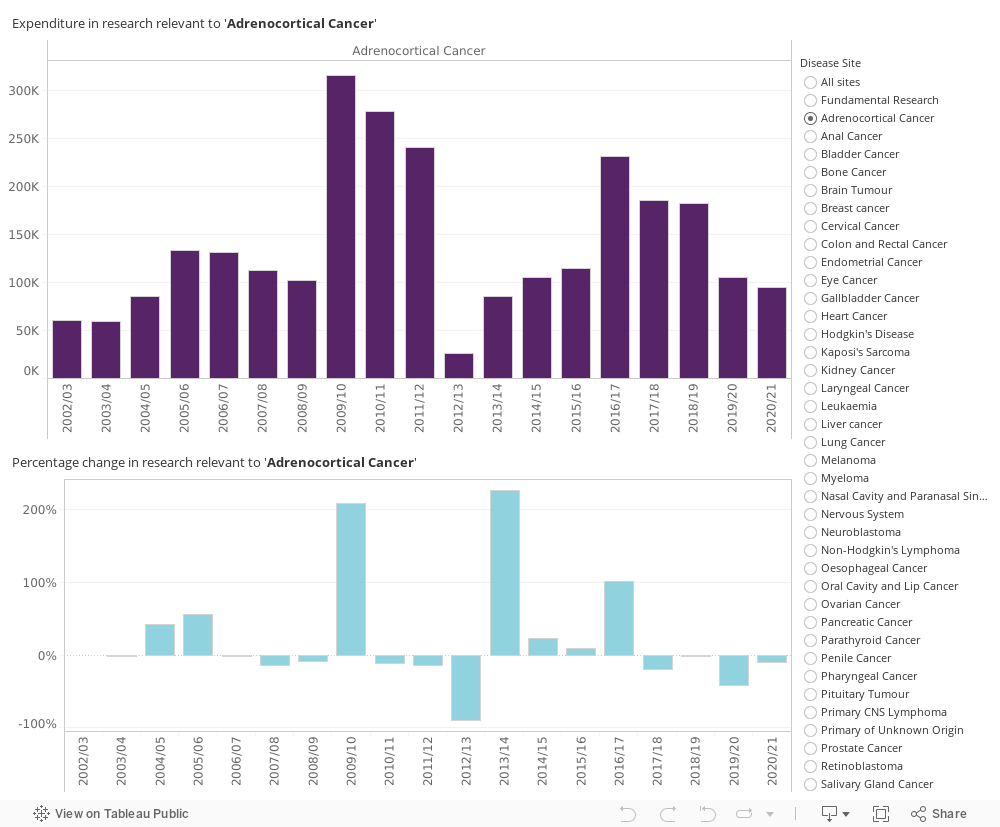
The filter on the right hand side allows you to select a particular disease site. The graphs below show how spend relevant to the disease site is distributed across financial years from 2002/03 to 2020/21.
The two graphs both show the contribution made by NCRI Charity and Government Partners, either combined – to show the total amount, or separated – to show the relative contributions more clearly. Spend has not been adjusted for inflation and represents the cash value at the time the award was submitted.
Figures and graphics can be downloaded using the download button at the bottom of the page.
*Please note, this visualisation is best viewed on PC or Mac.